I have not posted for a while but interesting math still has been adding up.
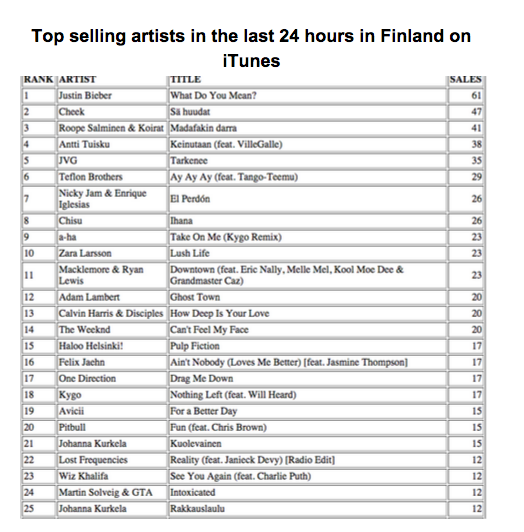
I posted previously about iTunes and statistics. I recently revised the activity to compare more countries and introduce statistics. The students were give data from USA, Australia, Nigeria, India, and Germany and put in groups to look through the top 20 sales in iTunes.
While the students sorted the data they listened to the songs, discovered Bollywood, Highlife from Nigeria and realized the Justin Bieber was a hit across the board. Here is the student handout. I distributed using google docs so the students could edit the document together and have it as a record.
The second activity investigated how statistics can be used to change policy. The students first watched The Story of the Plastic Water bottle to understand . And then were given data from Rock Creek Conservancy on trash pick ups from the last years. Students were given an introduction on excel formulas, how to sort data and needed to use statistical measures to investigate trends. The goal was to look at the local level, national and global, as well as exposed the students to the amount of plastic in our water ways.
More to come…